Device Memory Management
Welcome back! We’ve had a bit of a blog break to relax, enjoy the summer and hang out with friends and family. But now we’re back, and to kick things off I will walk you through my thoughts around strategies for managing device memory, but more importantly I will also show how important it is to have visual debug tools when working with memory management.
While The Machinery so far is Vulkan only, device memory management in DX12 is fairly similar so anything described in this post should be applicable to DX12. There’s a decent amount of information online (Lottes2016, Hebert2016, Sawicki2018) covering the various memory heaps and memory types in Vulkan, so instead of repeating the low-level API details and to make this post less Vulkan specific I’ll focus on a higher level.
Current Strategy
In our Vulkan render backend there are currently three types of memory that we reason about:
-
Device Local — This is GPU local memory that isn’t visible on the host/CPU side. All persistent GPU resources are backed by device local memory.
-
Staging Uncached — This is system memory that is visible on the host/CPU side, it’s coherent — i.e. no need to explicitly call
vkFlushMappedMemoryRanges()/vkInvalidateMappedMemoryRanges()— but uncached — i.e. reads are slow — on the host side. Typically all transfers of data from host/CPU to device/GPU uses this memory type. -
Staging Cached — This is system memory that is host visible, coherent and cached. Transfers going from the device/GPU to the host/CPU use this memory type.
The different types of memory are accessed through a common allocator API called device_memory_allocator_i which looks something like this:
struct device_memory_allocation_t
{
    // Handle to device memory.
    VkDeviceMemory memory;
    // Byte offset into device memory.
    uint64_t offset;
    // Size of allocation in bytes.
    uint64_t size;
    // If the memory served by the allocator is host visible 'host_mapped' will
    // point to the first byte of the allocation (i.e offset has already been
    // added).
    void *host_mapped;
};

struct device_memory_allocator_i
{
    struct device_memory_allocator_o *inst;

    struct device_memory_allocation_t (*allocate)(
        struct device_memory_allocator_o *inst, uint64_t size,
        uint64_t alignment, const char *debug_tag);

    void (*free)(struct device_memory_allocator_o *inst,
        const struct device_memory_allocation_t *allocation);
};
On top of this interface there are a few different allocators implemented exposing the three different types of device memory:
-
Device Local memory is handled by two types of allocators:
-
Allocations that are smaller than or equal to 256MB are directed to a Buddy Allocator that in turn allocates memory in blocks of 256MB using
vkAllocateMemory(). -
Allocations larger then 256MB falls back to use a “dedicated allocator” that maps 1:1 with a call to
vkAllocateMemory(). I’ve made the assumption that allocations larger than 256MB will be rare but we still need to be able to handle them.
-
-
Both Staging Uncached and Staging Cached memory use a Linear Allocator that in turn allocates memory in blocks of
max(size, 256MB). When the transfers of all allocations within a block are complete the memory block will be reused by the allocator.
Debug Visualization
We’ve been running with the above described strategy for managing device memory for some time now and while it so far has worked just fine, I’ve had an itching feeling that I should take the time to add some kind of debug view for visualizing our memory usage. Last week I finally got around to doing just that and added a new tab called Device Memory Analyzer to The Machinery.
Here’s a screenshot showing a somewhat naive and extreme case with a bunch of glTF-scenes loaded running with uncompressed high-resolution textures:
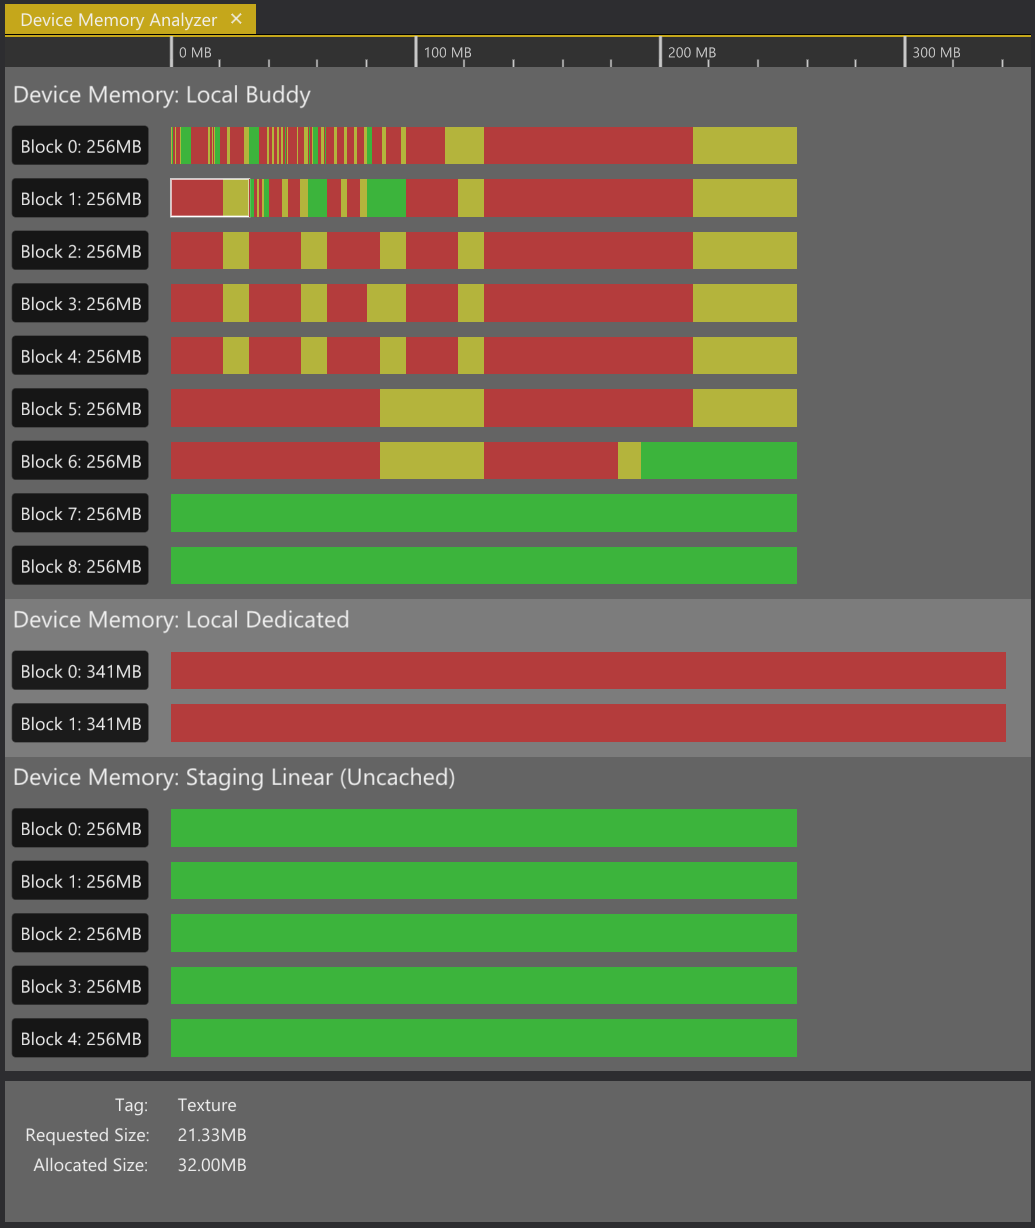
The “Device Memory Analyzer” tab in The Machinery
The view shows a breakdown of memory blocks allocated by each allocator. Each block corresponds to a call to vkAllocateMemory(). (Note: In the above example there’s one allocator missing, the “Staging Linear (cached)” since no read backs from GPU to CPU have been done in the running session.)
The view can be zoomed in/out and scrolled left/right. Green indicates free memory within a block, red indicates allocated memory in use by a resource, and yellow shows potential overhead caused by the allocation algorithm (i.e. internal fragmentation). By clicking on a red/yellow chunk the information panel will display more detailed information about the resource currently being mapped to that memory range.
From the above breakdown it quickly becomes apparent that we are wasting a bunch of memory due to the Buddy allocator’s implicit requirement of rounding allocation sizes to the next power-of-two. While this didn’t come as a surprise it’s still something that is easy to ignore unless clearly visualized like this. We also get a good understanding of how fragmented each memory block is. On top of that it also shows that we never release any blocks after they’ve been allocated even though they are completely free.
The takeaway here is simple — visual debug tools like this is key to quickly grasp any flaws or bugs in your systems, but unless you work in a framework that makes it trivial to implement them there’s a huge risk they will never get added. The above view didn’t take me more then a day to implement and is no more than 400 lines of C-code.
Improvements
So now when we’ve seen our current state of device memory management, let’s discuss some various improvements and other ideas.
First of all it feels fairly clear that we want to move away from using a Buddy allocator when managing memory for semi-static GPU resources like textures. One alternative would be to push more responsibility over to the user of our render backend APIs and expose a clear separation between memory management and resource creation/destruction. By doing so the user could group multiple GPU resources with the same life scope together into a single memory allocation with the goal of minimizing the power-of-two overhead caused by the Buddy allocator. While that would work in theory, it does not feel very clean to leak low-level render backend specific details into a high-level API. With that said, there’s another reasons for why it’s tempting to decouple device memory management from resource creation and destruction — it would make for a cleaner API when aliasing two or more resources on top of the same memory.
Resource aliasing is something that isn’t very common but for large transient resources like render targets it can give significant memory savings [O’Donnell17], especially when rendering in high resolutions like 4K. My current take for handling resource aliasing in The Machinery has been to allow a resource to specify that it is aliasing another resource by pointing out the other resource using its resource handle. While this approach works, the API would become a lot cleaner if the device memory allocation itself became a resource, and instead of pointing out another buffer- or image- resource to alias the user would point to the new “device memory” resource (potentially also allowing to specify a byte offset into the allocation).
As for replacing the Buddy allocator I’ve been planning to look into implementing a TLSF allocator but haven’t got around to it yet. Another alternative that probably is worth exploring in more detail would be to plugin AMD’s VulkanMemoryAllocator. It would inject at a higher level though and while it looks well designed I’m a bit reluctant replacing the 1000 lines of C-code that makes up my current device memory management system with 14000 lines of C++-code that someone else has written.
Speaking of AMD, their GPUs exposes a 256MB device local heap that is accessible directly from the host, i.e. it can be mapped for writes. Currently we do not expose access to this heap in The Machinery, meaning that any update of a resource, no matter how small it is or how frequent we need to update it, always ends up as a staged update. It would be nice if we could utilize this heap for resources in need of frequent host updates (like constant buffers) and it shouldn’t be too hard to implement an abstraction that falls back to staged updates on GPUs not exposing this heap. This is definitely something I’m planning to explore in more detail moving forward.