The Machinery Beta — April 2020 (version 2020.4)
Welcome to the second release of The Machinery Beta — April 2020! We have a number of new features and updates in this release that we hope you will like. As always, registered beta users can download the build from our forum. If you want to join the beta, sign up! If you find bugs in this release or have requests for specific features, post them to our issue tracker. For more general discussions, hit us up on the forum or on discord.
Some of the key highlights in this release are:
-
Viewport HUD — Quick access to viewport settings.
-
Tab pinning — Quickly jump between recently viewed objects and pin tabs to focus on specific objects.
-
Hierarchical prototypes — Proper workflows for hierarchical prototypes — i.e. prototypes of prototypes.
-
Statistics view — Visualize engine counters using graphs.
-
Internet collaboration — Internet connection options in collaboration tab.
-
Mouse help text — Status bar shows available mouse actions.
-
GPU Simulation — A new system for authoring GPU Simulations in the Creation Graph.
In addition we also made a number of smaller improvements and bug fixes.
Viewport HUD
We’ve added a Viewport HUD — a set of controls in the Scene Tab that gives you quick access to commonly used scene settings:
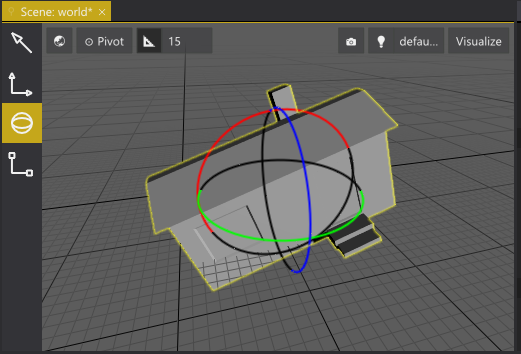
The Viewport HUD appears at the top of the Scene viewport.
The following options can be controlled from the Viewport HUD:
| Icon | Action |
|---|---|
 |
Toggle between using global and local space for gizmos. |
 |
Set the pivot point to use when multi-selecting. |
 |
Enable/disable snapping and set the size of the snapping grid. |
 |
Select a camera in the scene to use for the viewport. |
 |
Toggle lighting environment on/off and pick which lighting environment to use. |
 |
Set the render visualization mode. |
Enabling a lighting environment is useful for viewing assets that don’t include their own light or skydome. In the Scene tab, the lighting environment will be enabled by default when the asset doesn’t have any lights:

Enabling and disabling lighting and picking an lighting environment.
The Visualize control lets you enable specific visualization modes, such as Normals, Specular, etc.

Visualizing normals.
A subset of the controls in the Viewport HUD are also available in the Preview tab.
Tab pinning
The tab pinning system gives you greater control over how tabs are connected in The Machinery.
As an example, consider what happens when an asset is selected in the Asset Browser — a preview of the asset is opened in the Preview tab and the properties of the asset are shown in the Properties tab. Similarly, if you double click the asset, it’s opened in the Scene and Entity Tree tabs.
But what happens if you have multiple Properties and Preview tabs open? And what happens if those tabs are in different windows?
By default, a tab listens to events from other tabs in the same window. So a Properties tab will change the object it shows whenever an object is selected in any tab in its window. If there are multiple Properties tabs in the same window, only the most recently used one will be updated. The same applies whenever you have multiple tabs of the same type. So if you have multiple Scene tabs and double click an entity in the Asset Browser, the entity will be opened in the most recently used Scene tab.
The default behavior works well in most cases, but if you want to change it you can use the Pin option in the tabs’ context menus.
There are multiple types of “pinning” you can use for a tab, each type is indicated by an icon on the left edge of the tab:
| Icon | Meaning | Description |
|---|---|---|
 |
Unpinned | The tab has the default behavior. |
 |
Pinned to object | The tab is locked to viewing the current object and won’t react to selection changes. |
 |
Pinned to tab | The tab listens to events only from a certain other tab (or set of tabs). |
 |
Pinned to window | The tab listens to events only from a certain other window (or set of windows). |

Pinning a tab to an object locks the tab to viewing that object.
Using the pin-to-tab feature you can for example set up two Asset Browsers and two Preview windows, so that each Preview is connected to one of the Asset Browsers:

Pin-to-tab lets you connect tabs to other tabs.
In addition to pinning options, the tab context menu now also has a Recent Objects option. This let’s you quickly jump back and forth between objects that have been recently shown in the tab:

Recently viewed objects appear in the Recent Objects menu.
Another feature we added to the tabbing system is the option of shift-dragging a tab in order to create a copy of it.
Hierarchical prototypes
The Machinery now has full support for hierarchical prototypes. This means that you can create a prototype from a prototype and a prototype from that. When you Propagate Changes from an instance, the changes will be moved to the instance’s immediate prototype.

Hierarchical prototypes and propagating changes between them.
Statistics view
We’ve added a Statistics View that let’s you view real-time statistics for various engine counters. The data can be presented either as a table or as a graph.
For now we’ve exposed counters for some render statistics as well as all our profiler counters. You
can also add your own counters from a plugin. Look at the statistics_source.h API for information
on how to do that.

Statistics view.
Internet collaboration
In addition to LAN collaboration we also now support collaboration over the Internet. Note that when connecting over the Internet, you must explicitly specify the IP and port that you want to connect to. We don’t provide any NAT punch-through, so you must specify your external IP and make sure that the port you provide is open and routed to the hosting machine.

Joining an internet server.
Mouse help text
The status bar now presents help text for mouse actions. If you hold down a modifier key such as Shift, Alt, Ctrl, etc — the help text will update to reflect the action the mouse will do with that key held down.

Mouse help text.
GPU Simulation
A generic system for doing various types of simulation on the GPU has been added to the Creation Graph. This is still early in its development, but all of the core building blocks are there for you to play with. The initial focus has been to be able to do particle simulations but there’s nothing stopping you from using it for other stuff.

Simple particle effect.
The core creation graph nodes for setting up GPU simulations can be found under the category
Simulation:
GPUSim Init— Initializes a new simulation, defines what channels that should be part of each simulated element and sets the total number of elements in the system. Here you can also specify an optional life time.GPUSim Spawn— Injects new elements into the system, each new element is initialized by running a compute shader.GPUSim Reset— Resets the system.GPUSim Update— Updates all elements currently alive in the system using a compute shader.
You can access the channels of any element in the simulation for reading and writing using the nodes
GPUSim - Read and GPUSim - Write.

Creation Graph for a simple particle system.
For particle effects, an easy way to visualize the particles is to use the newly added Billboards Output node:

As all computations are done on the GPU we can easily simulate lots of elements, here’s an example of 1024x1024 (roughly 1 million) simulation elements each rendered as a billboard grabbing its color from an image.
Over the coming weeks we will be rolling out samples showing how to create various types of effects using this new system.
Smaller updates
UI
- When an item is pasted or duplicated in the Asset Browser, it gets selected.
- Better framing of entities with no render components in the Scene Tab.
- Newly focused properties no longer lose focus after being tabbed to.
- Pressing Shift-Tab in the Entity Tree brings up an Add Entity From Asset… popup box.
- The Asset Browser context menu now has a Duplicate command.
- Asset Browser > New has been changed to a submenu.
- The dropdown menu used to propagate changes, etc in the Properties tab has been changed to a context menu.
- The property context menu now works in the Graph.
- The property context menu has a highlight, telling the user which property the hovered item affects.
- All asset pickers have now have a “Find Asset” context menu option:

- The node hierarchy in the Scene Tree Component can now be inspected in the Properties tab.
- Added a Make Unique (Detach from Prototype) context menu item to the Entity Tree tab.
- Double-clicking in the Entity Tree tab will now open the prototype asset (if any) instead of framing the entity in the Scene tab. Press F to frame the entity.
- Better visualization when browsing for assets in the Properties tab:

- Tooltips now appear relative to the cursor and behave more like other tooltips in Windows.
- The Windows mouse setting “Switch primary and secondary buttons” is now respected.
- The Scene tab toolbar no longer overlaps the viewport, making the center of the viewport the true center.
- File names are now shown in the tooltips when hovering over profiling scopes in the Profiler tab.
- It is now possible to import assets by dragging files from the Windows Explorer and dropping them onto the Asset Browse.
- Images can now be imported without needing to rig a creation graph.
Graph
- Clicking in empty area while connecting now opens the Add Node menu.
- Instanced graphs work better. There are now explicit workflows for overriding graph data.
- Pasting instanced graph nodes now pastes a prototype-detached copy.
- Fix for a crash when a Delay node with time=0 was used in the visual scripting graphs.
- If you click on a graph node property while in the process of connecting nodes, the connection is now aborted.
- Changed Center View to Frame Selected.
Rendering
- Fix for crash in shadow mapping when using IBL lights.
- Support for handling negative scale numbers in DCC Asset Component and Render Component.
- Moved to using “Reversed Depth” (aka Reversed-Z) with a floating point depth buffer.
- Normal vectors are now correct even if the transform contains non-uniform scaling.
- Fix for bounding volumes of DCC Asset Components sometimes becoming too large.
- Support for multi-draw indirect in
tm_renderer_draw_call_info_t. - Support for dispatch indirect in
tm_renderer_compute_info_t.
Samples
- The
TM_SAMPLE_PROJECTSenvironment variable has been changed toTM_SAMPLE_PROJECTS_DIRto better match other engine environment variables. - The samples now include a sample plugin with custom nodes for the Visual Scripting graph.
- A broken link in the
README.md.htmlfile has been fixed. - The
utilsfolder in the beta release now includes a premake file so you can build the utilities usingtmbuild. - Fix for
LNK4099warning about missingfoundation.pdbwhen building samples.
Platform support
- We now support running on CPUs without AVX support.
- We now support running on CPUs without FMA3 support.
Collaboration
- Fix for a client-side crash in collaboration after syncing the project.
- Fix for error messages displayed in collaboration due to missing client-side default data.
- LAN hosts are now cleaned out from the Join list when they disconnect.
Core
- New empty projects are no longer marked as dirty and in need of saving.
- Files that are not recognized by The Machinery (i.e. files with extensions that don’t start with
tm_) are now ignored and left alone in The Machinery directory projects. - Performance fixes to reduce the calling frequency of some expensive Windows API functions, such as
XInputGetState()andWindowFromPoint(). - The Machinery version number is now printed at the top of the log.